When you're mapping out retirement withdrawals for two people, particularly with a Substantially Equal Periodic Payment (SEPP) plan, the IRS's joint life expectancy tables become an absolutely critical tool. Think of these actuarial tables as the foundation for creating a steady income stream that’s designed to last for both partners' lifetimes. Getting this right is a cornerstone of solid long-term financial planning for couples.
What Are Joint Life Expectancy Tables

At their core, joint life expectancy tables are actuarial tools that financial planners use to estimate the remaining lifespan of two individuals—usually spouses—as a single unit. These tables are the bedrock for structuring payments from pensions and annuities because they calculate the probability that at least one of you will still be alive at any given point in the future.
This is a big step up from a single life expectancy calculation, which only projects one person's lifespan. By looking at both lives together, a joint calculation gives you a longer timeframe to work with, which is exactly what you need when planning a shared retirement.
Why These Tables Matter for Your Retirement
Using the correct table isn't just a good idea; it's a hard-and-fast IRS requirement if you're using a withdrawal strategy like the 72(t) SEPP. Choosing the right joint table ensures that your calculated withdrawal amount is compliant, which is your best defense against some pretty hefty penalties.
Here are a few key reasons why you need to get familiar with these tables:
- Ensuring Lifelong Income: They are the key to structuring withdrawals that can support both you and your spouse for as long as either of you is living.
- Avoiding IRS Penalties: A miscalculation can completely disqualify your SEPP plan. If that happens, you’ll face a 10% early withdrawal penalty, plus interest, on every single distribution you've already taken.
- Accurate Financial Projections: These tables provide the specific, IRS-approved factor needed for the amortization or annuitization methods within your 72(t) calculation.
Ultimately, these tables provide the statistical backbone for building an income stream you can truly rely on. You can get a deeper look into how the IRS calculates life expectancy to see just how central these figures are to the government's retirement rules.
Choosing The Correct IRS Life Expectancy Table
Getting your 72(t) SEPP calculation right starts with one crucial first step: selecting the appropriate IRS life expectancy table. Think of it as the foundation of your entire withdrawal plan—get it right, and you're on solid ground. A simple mistake here can lead to a disqualified plan and some pretty hefty penalties from the IRS.
Luckily, the IRS provides three distinct tables, and figuring out which one to use is actually quite straightforward. It really boils down to your marital status and who you've named as the beneficiary of your retirement account. Using the wrong one, like the Uniform Lifetime Table when you actually need the joint life expectancy tables, will throw off your distribution amount and put your plan at risk.
The Three IRS Tables
The IRS is very specific about when to use each table for calculating required minimum distributions (RMDs) and, by extension, SEPP withdrawals. Here’s a quick rundown to help you pinpoint the right one for your situation.
-
Uniform Lifetime Table: This is the table most people are familiar with. It's the standard for RMD calculations for account owners whose spouse is not their sole beneficiary or isn't more than 10 years younger.
-
Single Life Expectancy Table: This one comes into play for beneficiaries who have inherited a retirement account. As the name suggests, it calculates distributions based on their own single life expectancy.
-
Joint Life and Last Survivor Table: This is the key table for married couples where the spouse is the sole beneficiary and is more than 10 years younger than the account owner. For a 72(t) SEPP, it's mandatory when your calculation is based on the joint lives of you and your spouse.
Which IRS Life Expectancy Table Should You Use?
Choosing the right table is non-negotiable for a compliant plan. This quick comparison should help you identify the correct IRS table based on your marital status and beneficiary designation.
| Table Name | Primary User | Common Application |
|---|---|---|
| Uniform Lifetime Table | Most unmarried account owners; married owners with a non-spouse or younger spouse. | The default table for most RMD calculations. |
| Single Life Expectancy Table | A non-spouse beneficiary who has inherited a retirement account. | Calculating required withdrawals from an inherited IRA or 401(k). |
| Joint Life and Last Survivor | A married account owner whose spouse is the sole beneficiary and >10 years younger. | Mandatory for joint life 72(t) SEPP calculations; optional for RMDs in the same situation. |
Ultimately, for couples basing their 72(t) withdrawal on both of their lives, the Joint Life and Last Survivor table is not just an option—it’s a requirement. It's designed to accurately reflect the longer time horizon needed to support both partners, which is the whole point of a joint retirement income strategy.
At Spivak Financial Group, we help our clients navigate this critical choice to make sure their 72(t) plans are built correctly from day one.
How To Read The Joint Life And Last Survivor Table
At first glance, the IRS Joint Life and Last Survivor Expectancy Table can look a little intimidating. The good news? It's actually pretty straightforward once you know how it's laid out. Think of it as a simple grid. One spouse's age runs down the side, and the other's runs across the top. All you have to do is find where those two ages meet.
That number at the intersection of your two ages is your joint life expectancy factor. This is the exact figure you'll plug into the amortization or annuitization method when you calculate your 72(t) SEPP withdrawal. In simple terms, it represents the average number of years that at least one of you is expected to be alive.
A Practical Walkthrough
Let's walk through a quick example to see just how easy this is.
Imagine a married couple. One spouse is 65 years old, and the other is 62 years old. To get their joint life expectancy factor, they just need to:
- Find the age 65 on one axis of the table.
- Find the age 62 on the other axis.
- Follow that row and column until they meet in the middle.
For a 65 and 62-year-old couple, that magic number is 26.9. This single factor is the foundation of a compliant 72(t) calculation for a couple, ensuring the payments are correctly spread over both of your expected lifetimes, just as the IRS requires.
This infographic can help you visualize how to pinpoint your specific factor on the table.
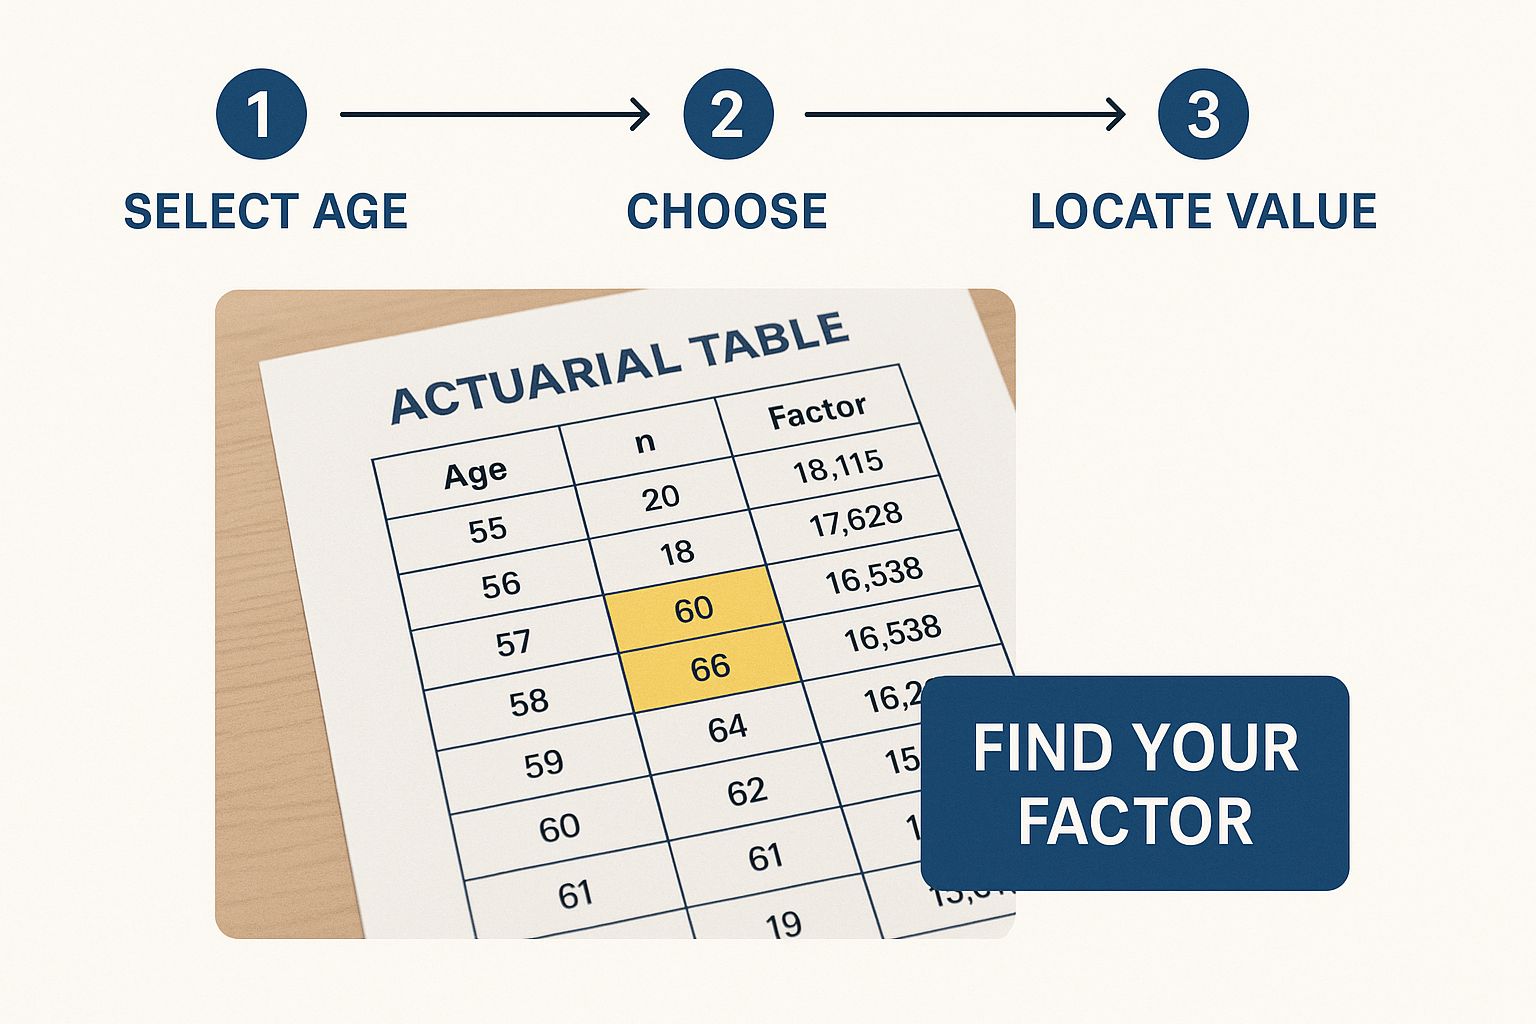
As you can see, the flow is simple: find the two ages on the grid, and their intersection gives you the one critical number you need for your SEPP calculation. You can find the official IRS table online, which is always the best place to get the most current and compliant data for your planning.
Applying Your Factor In 72(t) SEPP Calculations
Once you've found your specific factor in the joint life expectancy tables, it's time to put it to work. This is the point where that number on the table translates into a real, tangible withdrawal amount you can take from your retirement account each year.
This factor is a crucial piece of the puzzle for the two most common 72(t) SEPP calculation methods: amortization and annuitization.
Let's walk through a practical example to make this clear. Imagine a married couple, Pat and Sam. Pat is 60, and Sam is 58. They're ready to start a 72(t) SEPP plan with their joint IRA, which currently has a balance of $750,000. We'll also need a reasonable interest rate—for this scenario, let's use the federal mid-term rate—of 4.5%.
Applying The Factor With The Amortization Method
Think of the amortization method as working a bit like a mortgage payment. It's designed to create equal, steady payments over a specific period. In a 72(t) plan, that period is defined by Pat and Sam's joint life expectancy.
First, we need their joint life expectancy factor from the IRS table. Looking up a 60-year-old and a 58-year-old, we find their factor is 30.5.
With that number, we can complete the amortization calculation. The formula divides the account balance by a present value factor, which is calculated using their joint life expectancy (30.5) and the interest rate (4.5%). For Pat and Sam, this calculation results in an annual withdrawal of $45,395.
How The Annuitization Method Uses Your Factor
The annuitization method approaches the calculation a little differently. Instead of amortizing the balance, it divides the account by an annuity factor derived from the life expectancy table and an allowable interest rate. It basically simulates what you might get from a commercial annuity.
Using the exact same variables—the $750,000 balance, the 4.5% interest rate, and the 30.5 joint life expectancy factor—the annuitization method produces a very similar annual distribution. In this case, Pat and Sam's annual withdrawal would be $45,419.
As you can see, both methods depend heavily on that joint life expectancy factor to correctly spread payments over both individuals' lifetimes. This is what keeps the withdrawal amount compliant with IRS rules and sustainable for the long haul.
For a deeper dive into these formulas, you can explore our detailed guide on how to calculate Substantially Equal Periodic Payments. At Spivak Financial Group, our experts can run these precise calculations to ensure your SEPP plan is structured correctly from the start.
The Actuarial Science Behind The Tables
Ever wonder what goes into making the joint life expectancy tables so accurate? It’s a lot more than just simple averages. These tables are grounded in some pretty sophisticated actuarial science that models how long two people are likely to live as a pair, which is a critical piece of the puzzle for long-term financial planning.
Unlike a single life expectancy calculation, a joint table doesn't just treat two lives as separate events. It has to account for the statistical dependency between partners. Think about it—factors like shared lifestyle, diet, and mutual care often mean spouses' lifespans are correlated. This concept is vital for creating a reliable income stream designed to last for both individuals.
The Widowhood Effect Explained
A key principle in this science is something actuaries call the "widowhood effect." This isn't just a turn of phrase; it's a statistical reality. It recognizes that the mortality risk for a surviving spouse often spikes, especially in the months right after losing their partner.
From a numbers perspective, joint life expectancy is built on the fact that spouses' lifespans aren't independent. In fact, studies show a surviving spouse's risk of death can increase by 40-50% in the first few months after their partner’s death. You can dig deeper into life expectancy demographics on worldometers.info to see the broader data.
This statistical link is exactly why the IRS requires using joint tables for certain retirement plans. A joint calculation gives a more accurate—and usually longer—time horizon, which directly impacts the withdrawal amount calculated for a 72(t) SEPP.
Ultimately, this level of actuarial detail makes sure that a financial plan is built on solid ground. It respects the interconnected nature of a couple's lives and provides a much more robust framework for lasting financial security. Of course, the calculation also hinges on a reasonable interest rate, and you can learn more about the difference between the rate of return vs the IRS interest rate in our detailed guide.
Common Mistakes To Avoid With Life Expectancy Tables

Getting the joint life expectancy tables right is absolutely critical for a compliant 72(t) plan. Even what seems like a minor slip-up can have massive consequences, potentially getting your entire SEPP plan disqualified by the IRS. Suddenly, that steady income stream you planned on turns into a major financial headache.
The fallout from a busted 72(t) plan is severe. The 10% early withdrawal penalty gets slapped on every single distribution you've taken, retroactively, plus interest. This can gut the very funds you were counting on for your early retirement.
Understanding the common pitfalls is the best way to protect yourself and your retirement savings.
Choosing The Wrong Table
One of the most frequent and costly errors we see is simply picking the wrong table from the start. For example, someone might accidentally use the Uniform Lifetime Table when their plan is supposed to be based on the lives of both spouses. This single mistake throws off the entire calculation and makes the plan non-compliant from day one.
For any 72(t) SEPP calculation that involves two lifetimes, using the Joint Life and Last Survivor Table is mandatory. There are no exceptions. Double-checking that you have the right table for your specific situation is a non-negotiable first step.
Misreading Ages Or Using Outdated Tables
Another all-too-common issue comes down to simple human error. It’s surprisingly easy to transpose digits in an age (reading 67 as 76) or to misalign the row and column when you're looking at the chart. This leads directly to the wrong life expectancy factor.
Likewise, the IRS updates these tables periodically. Using a version from a previous year will immediately invalidate your calculations. It's a guaranteed way to bust your plan before it even gets off the ground.
Always pull your table directly from the most current version of IRS Publication 590-B. Never rely on an old download or a saved copy.
Ignoring The 10-Year Age Gap Rule
While this rule is more often associated with Required Minimum Distribution (RMD) calculations, it can create confusion in 72(t) planning as well. If your beneficiary is not your spouse and is more than 10 years younger than you, specific rules kick in that can limit the life expectancy figure used in your calculation. Misinterpreting this can lead to an incorrect, and non-compliant, withdrawal amount.
The key to avoiding these expensive mistakes is meticulous attention to detail.
- Verify your table: Confirm you are using the correct and, most importantly, the most current IRS Joint Life and Last Survivor Table.
- Check your inputs: Slowly and carefully find the exact ages for both individuals on the table. Have someone else check it if possible.
- Seek guidance: These rules are complex, and the stakes are high. Consulting with a specialist at Spivak Financial Group can ensure your plan is built on accurate data from the very beginning.
Frequently Asked Questions
When you're trying to figure out the rules for joint life expectancy tables, it's natural to have a few questions. This is especially true when you're setting up something as important as a 72(t) SEPP. Here are some straightforward answers to the questions we hear most often from clients planning their early retirement.
These are the real-world scenarios that come up all the time, and getting the details right is what keeps your withdrawal plan compliant and secure.
What Happens If My Spouse and I Have a Large Age Gap?
A big age gap between spouses is exactly what the Joint Life and Last Survivor Table is built for. It’s designed to account for this very situation. For example, if you have a 70-year-old with a 55-year-old spouse, their joint life expectancy factor will be longer than a couple who are both the same age.
The practical result is a smaller, more sustainable annual distribution from your 72(t) plan. This makes sense because the money has to last long enough to support the younger spouse through their entire life. You must always use both of your actual ages to find the correct factor for your calculation.
Can I Switch from a Single to a Joint Life Calculation?
The answer here is a hard no. Once you've established your 72(t) SEPP plan, the calculation method—including the life expectancy table you chose—is locked in. The IRS sees changing the table as a modification of the plan, which is a major violation that can get the whole thing disqualified.
If your plan gets disqualified, every distribution you've already taken becomes subject to the 10% early withdrawal penalty, plus interest. The only change the IRS typically allows is a one-time switch to the Required Minimum Distribution (RMD) method. That's why it is absolutely critical to select the right table from the very beginning.
Your initial choice of life expectancy table is a foundational decision for your 72(t) SEPP. An incorrect choice at the beginning cannot be fixed later without potentially busting the entire plan and incurring significant penalties.
Do I Have to Use the IRS Tables?
Yes, this is completely non-negotiable. When you're calculating 72(t) Substantially Equal Periodic Payments, you are required to use the specific life expectancy tables provided by the IRS. You can find these in Appendix B of Publication 590-B.
Other organizations, like the Social Security Administration or various insurance companies, have their own actuarial tables, but those are irrelevant for this purpose. Using any table other than the ones sanctioned by the IRS will lead to an incorrect calculation and will disqualify your plan.
Navigating these complex rules is essential for a successful 72(t) SEPP. At Spivak Financial Group, we provide the expert guidance needed to ensure your plan is built correctly from the ground up. To learn how we can help you unlock your retirement funds penalty-free, visit us at https://72tprofessor.com.
Spivak Financial Group
8753 E. Bell Road
Suite #101
Scottsdale, AZ 85260
(844) 776-3728
https://72tprofessor.com